
Relative and Absolute Risk: Read the Number Behind the Headline
Key Points:
- Relative change needs a starting risk to show how large an absolute difference is.
- Check the denominator, population, outcome and time period before comparing percentages.
- Hypothetical examples illustrate arithmetic and are not personal risk forecasts.
- A useful report includes both potential benefit and relevant harms or uncertainty.
A claim that a risk has fallen by half can describe a large change or a small one. The missing information is the starting risk. Before deciding whether a result matters, find out how many people experienced the outcome, how many were observed, and for how long. This is useful far beyond medical news: the same habit helps with product reliability, environmental reports and claims about educational interventions.
Two descriptions of the same comparison
The National Cancer Institute's screening overview distinguishes absolute risk from relative risk. Absolute risk describes an outcome’s probability in a defined population over a stated period. Relative risk compares risks between groups. Neither number is inherently misleading. Trouble arises when a headline supplies one without enough information to understand the other, or silently changes the population, outcome or time frame between sentences.
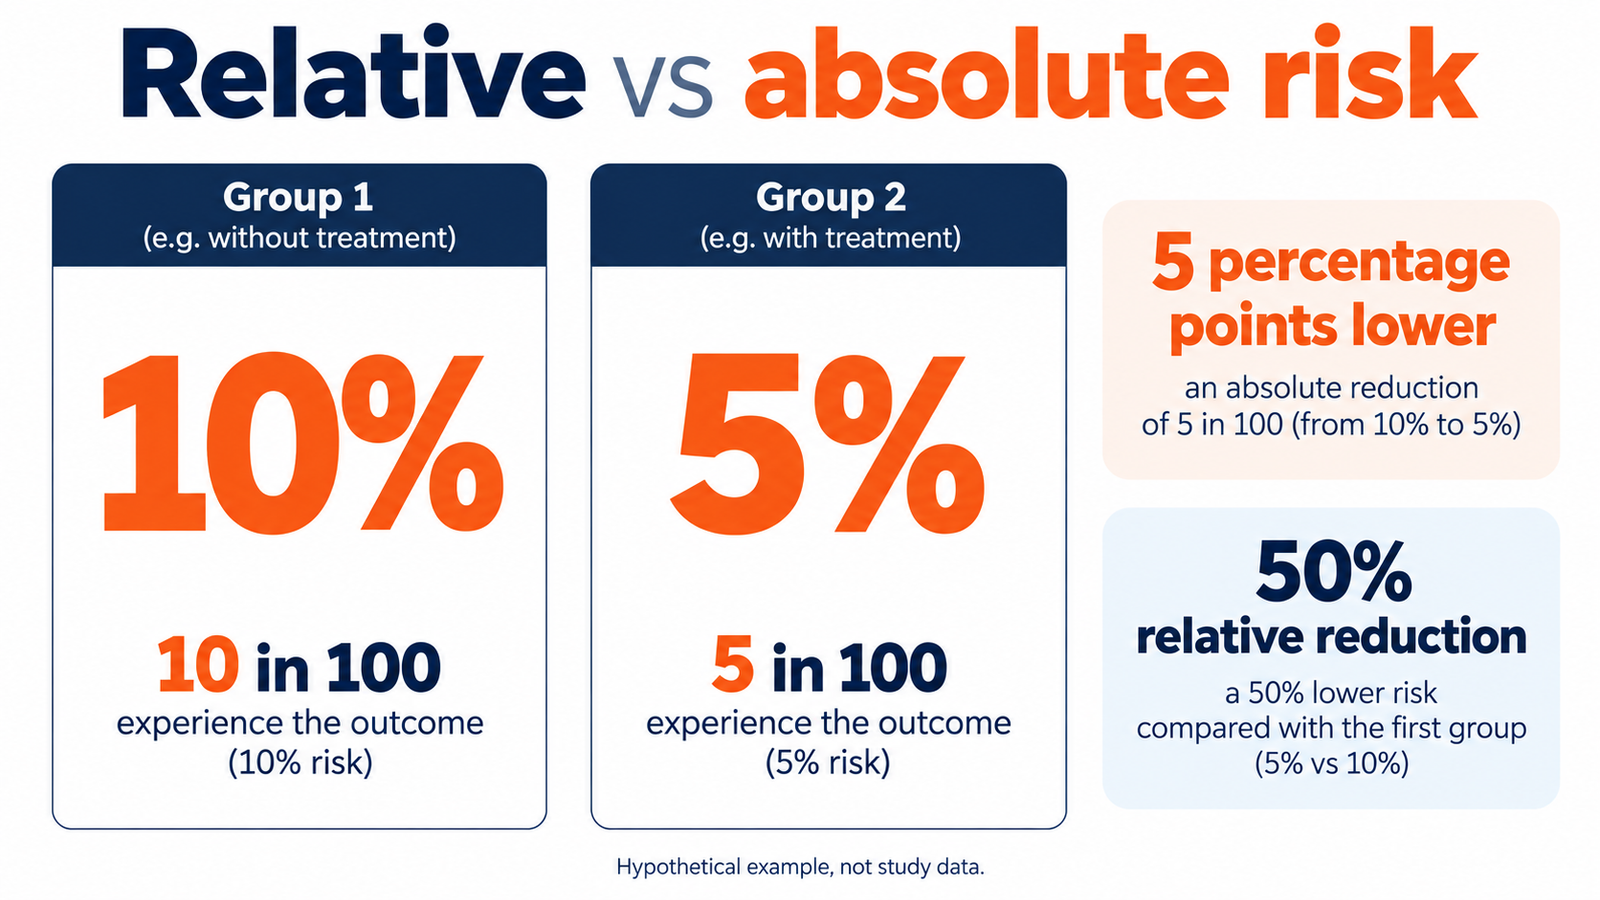
Consider an entirely hypothetical example. During one year, an outcome occurs in 10 of 100 people in Group A and 5 of 100 people in Group B. The risks are 10% and 5%. Subtracting gives a difference of five percentage points. Dividing 5% by 10% gives a risk ratio of 0.5. The second risk is half the first, which can also be described as a 50% relative reduction. These are different descriptions of the same invented numbers.
| Starting risk | Comparison risk | Absolute difference | Relative reduction |
|---|---|---|---|
| 10 in 100 | 5 in 100 | 5 percentage points | 50% |
| 2 in 100 | 1 in 100 | 1 percentage point | 50% |
| 2 in 1,000 | 1 in 1,000 | 0.1 percentage points | 50% |
The table shows why the starting point matters. Every row has the same relative reduction, but the absolute differences are not the same. A reader can understand the arithmetic without deciding whether any intervention is worthwhile. That later judgment also needs information about harms, costs, uncertainty, alternatives and the importance of the outcome. A correct percentage is only one part of an informed decision.
Keep the denominator and time window visible
Write a finding as a complete sentence: among this group, this many people experienced this outcome during this period. If any part is missing, mark it as unknown rather than filling the gap yourself. A lifetime risk cannot be compared directly with a one-year risk. A result in a highly selected trial population cannot simply be assigned to everybody who reads the story. The denominator tells you who was counted; it does not automatically tell you who the result applies to.
Imagine one report describing equipment failures per device and another describing failures per hour of operation. Both could be useful, but their denominators answer different questions. A device used continuously has more opportunity to fail than one kept in storage. Before comparing the figures, ask whether the amount of exposure was similar. This is an original example of denominator checking, not a claim about a particular instrument or brand.
Percentage points are not percentages
A change from 20% to 25% is five percentage points, but it is a 25% increase relative to the starting value. To check that calculation, subtract 20 from 25, then divide the difference by 20. The distinction becomes especially important when a story uses phrases such as five percent higher without saying which calculation it means. Rephrase the result in plain counts whenever the original information allows it.
Do not round too early. If the source gives counts, retain them in your notes even when the public explanation uses a simpler percentage. For a small sample, a change of one participant can noticeably change the percentage. That does not invalidate the study, but it makes the count valuable context. A polished chart with several decimal places is not evidence that the estimate is equally precise.
Ask what was actually measured
An improvement in a laboratory marker is not the same outcome as fewer symptoms, fewer hospitalizations or longer survival. A lower error rate on a test dataset is not necessarily a lower error rate in everyday use. The NCI’s discussion of screening benefits and harms is a reminder to ask about outcomes that matter, including false positives and unnecessary follow-up. Do not convert an intermediate measurement into a stronger claim without supporting evidence.
When reading a summary, underline the outcome noun. Is the claim about a diagnosis, a scan finding, a questionnaire score, a purchase, or a death? Then check whether the headline uses the same noun. If the headline says prevention but the study measured an association with a biomarker, the interpretation has moved beyond the observation. Identifying that shift is often more useful than arguing about the headline’s tone.
A comparison does not by itself establish cause
Risk arithmetic can describe both experiments and observational studies. Dividing two percentages does not turn an observational comparison into a randomized trial. Groups may differ in ways that also influence the outcome, and statistical adjustment cannot be assumed to remove every relevant difference. Conversely, a randomized trial still needs scrutiny of its participants, follow-up, missing data and outcome definitions. Read the design before choosing causal language.
Use a two-column note. In the first column, record what the researchers observed. In the second, record what the authors think explains it. Keep a third space for questions the study leaves open. This simple separation helps prevent a plausible mechanism from becoming an established explanation merely because it sounds convincing. It also makes it easier to revise your understanding when a later study measures a different outcome or population.
Read uncertainty alongside the estimate
An estimated risk is not a promise about an individual. If a report supplies a confidence interval, read it with the central estimate rather than discarding it because the headline contains a simpler number. If the summary does not provide uncertainty, look for the original report or an institutional explanation of the methods. Missing uncertainty should be described as missing; it should not be replaced with confident adjectives such as proven, guaranteed or risk-free.
Our practical reading checklist is: identify the population, define the outcome, match the time period, preserve the counts, calculate the absolute difference, and then examine the design and uncertainty. These steps do not require you to become a statistician. They create a pause between seeing an impressive percentage and accepting the interpretation attached to it. For personal health decisions, use that pause to prepare questions for a qualified healthcare professional.
Try a headline rewrite
Take the hypothetical first row and compare two headlines. One says the intervention halves risk. Another says five fewer people in every hundred experienced the outcome over one year. Neither sentence tells you whether there were side effects, whether the groups were randomized, or whether the difference might vary in another population. A responsible summary would add those details, or explain that they are unavailable, before encouraging a decision.
If you share a numerical claim, include its source and original date. Preserve the denominator when shortening the explanation for social media. Avoid replacing a cautious study conclusion with a dramatic personal recommendation. The goal is not to make every finding sound unimportant. It is to make important findings understandable at their actual scale, with enough context that another reader can check your reasoning rather than simply trust the percentage.